This is a book created from markdown and executable code.
Here is an example usecase of dplyr and ggplot
── Attaching core tidyverse packages ──────────────────────── tidyverse 2.0.0 ──
✔ dplyr     1.2.1     ✔ readr     2.2.0
✔ forcats   1.0.1     ✔ stringr   1.6.0
✔ ggplot2   4.0.3     ✔ tibble    3.3.1
✔ lubridate 1.9.5     ✔ tidyr     1.3.2
✔ purrr     1.2.2
── Conflicts ────────────────────────────────────────── tidyverse_conflicts() ──
✖ dplyr::filter() masks stats::filter()
✖ dplyr::lag()    masks stats::lag()
ℹ Use the conflicted package (<http://conflicted.r-lib.org/>) to force all conflicts to become errors
  species    island bill_len bill_dep flipper_len body_mass    sex year
1  Adelie Torgersen     39.1     18.7         181      3750   male 2007
2  Adelie Torgersen     39.5     17.4         186      3800 female 2007
3  Adelie Torgersen     40.3     18.0         195      3250 female 2007
4  Adelie Torgersen       NA       NA          NA        NA   <NA> 2007
5  Adelie Torgersen     36.7     19.3         193      3450 female 2007
6  Adelie Torgersen     39.3     20.6         190      3650   male 2007
penguins_counts <- penguins |>
  count(species, island)

penguins_counts
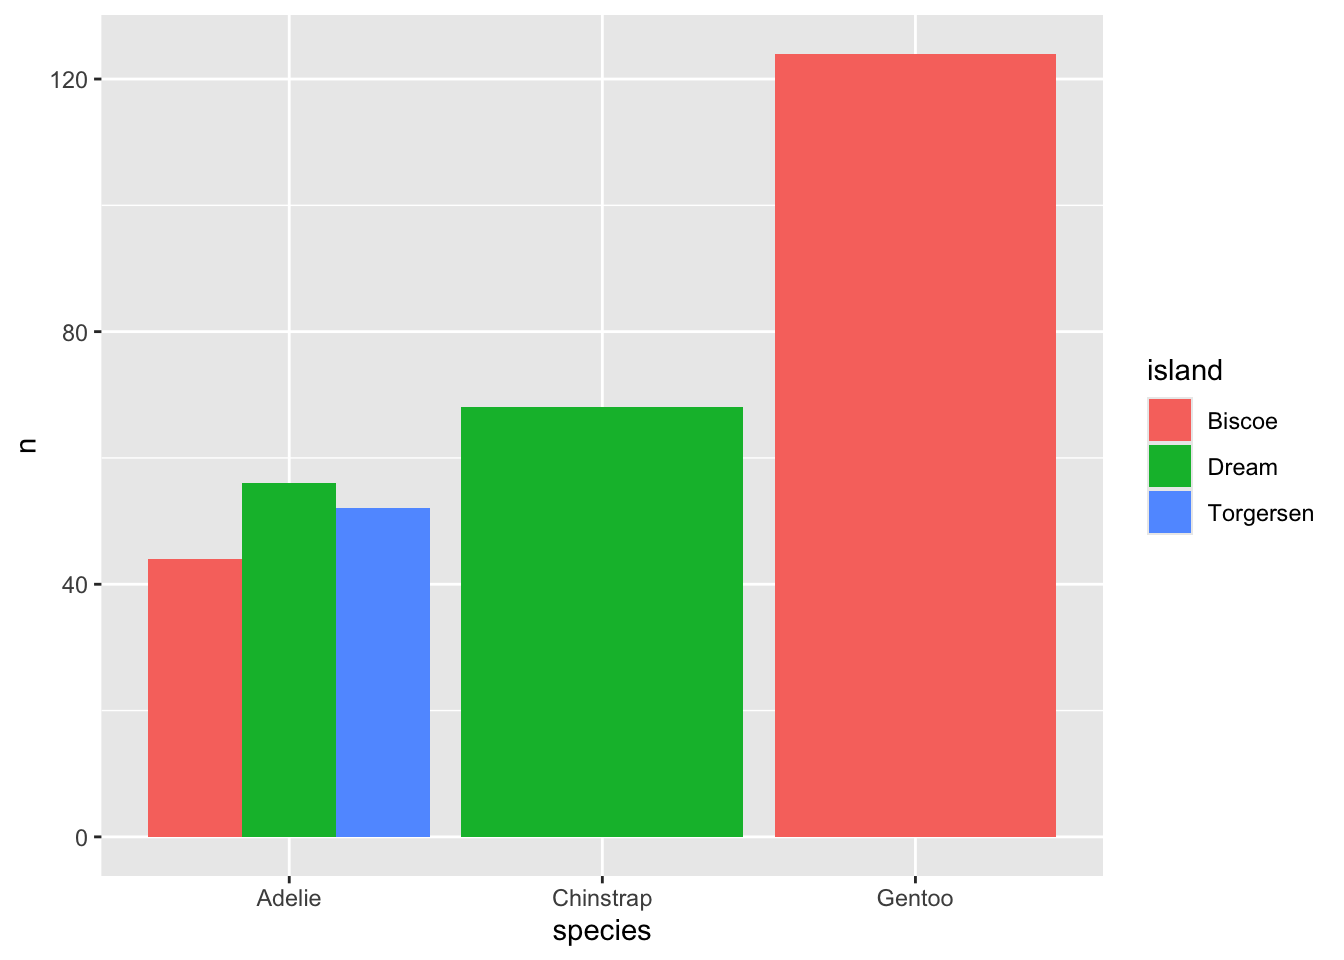
    species    island   n
1    Adelie    Biscoe  44
2    Adelie     Dream  56
3    Adelie Torgersen  52
4 Chinstrap     Dream  68
5    Gentoo    Biscoe 124
ggplot(penguins_counts,
       aes(x = species,
           y = n,
           fill = island)) +
  geom_col(position = "dodge")
See Knuth (1984) for additional discussion of literate programming.
Knuth, Donald E. 1984.
“Literate Programming.” Comput. J. (USA) 27 (2): 97–111.
https://doi.org/10.1093/comjnl/27.2.97.